What does a maritime cyber incident cost?
Some researchers abroad occasionally write about me, behind the paywall of their academic papers, that when I speak up it is to praise the resilience of the maritime sector and to argue that attacks on it are impossible. For someone who started this blog in 2017, when the subject was of no interest to anyone, who built the first global database of maritime cybersecurity incidents more than five years ago, and who describes part of it here, you will find that as funny as I do. Allow me only the freedom not to fan the flames, and to avoid, out of modesty or out of ethics, the “I told you so” and the “if you need me, I am here”.
Yes, the sector knows how to be resilient. Yes, some types, some generations and some shipboard installations are barely exposed to cyber threats. Should we congratulate ourselves and settle for a pat on the back? No. But, conversely, going from there to saying that the whole sector is highly vulnerable, or making sweeping statements… that is not what I do: every ship and every port is different. Anyway, let us move on.
The question that follows is one I am often and quite legitimately asked: leaving aside the well known Maersk case, do cyberattacks cost the sector anything? I usually answer by separating out the financial items involved, because one incident can produce several bills: lost customers, rebuilding information systems, incident response, insurance premiums, communications, fines. The cost then depends on what the company does, and therefore on its operations, and on the type of attack it suffered. State-sponsored attack, ransomware, hacktivism, payment fraud through business email compromise (BEC), these four families do not leave the same accounting trace. Here are some figures.
The dataset
The dataset I use covers 4,257 incidents between 1980 and 2026, in 165 countries and across twenty activities of the sector, with 336 actors and 116 malware families identified, and 340 campaigns reconstructed. It cites 8,029 references, dates 93.9% of its entries to the day, geolocates 95.5% of them, and rates each one under the Admiralty system, which scores source reliability and information credibility separately. The figures below are as at 27 September 2026.
Like any dataset, it carries biases. Its main bias is structural: this count rests on public sources only (though everyone works the same way). A victim who settles its incident with its insurer and its lawyer, without ever saying a word in public, does not appear in it, and its amount even less so. Countries with a dense specialist press and mandatory disclosure weigh more heavily than the others, which explains much of the place the United States holds in the amounts below. The figures given here are therefore a floor, never an estimate of the real cost borne by the sector.
The share of incidents with a figure
Of those 4,257 incidents, 83 carry an amount, or 1.9%, for 88 recorded amounts, since one incident can carry two when a ransom demand precedes a disclosed loss. An amount is recorded only when a reliable source attributes it to that victim and that incident. That 1.9% measures what has been published, and nothing else.
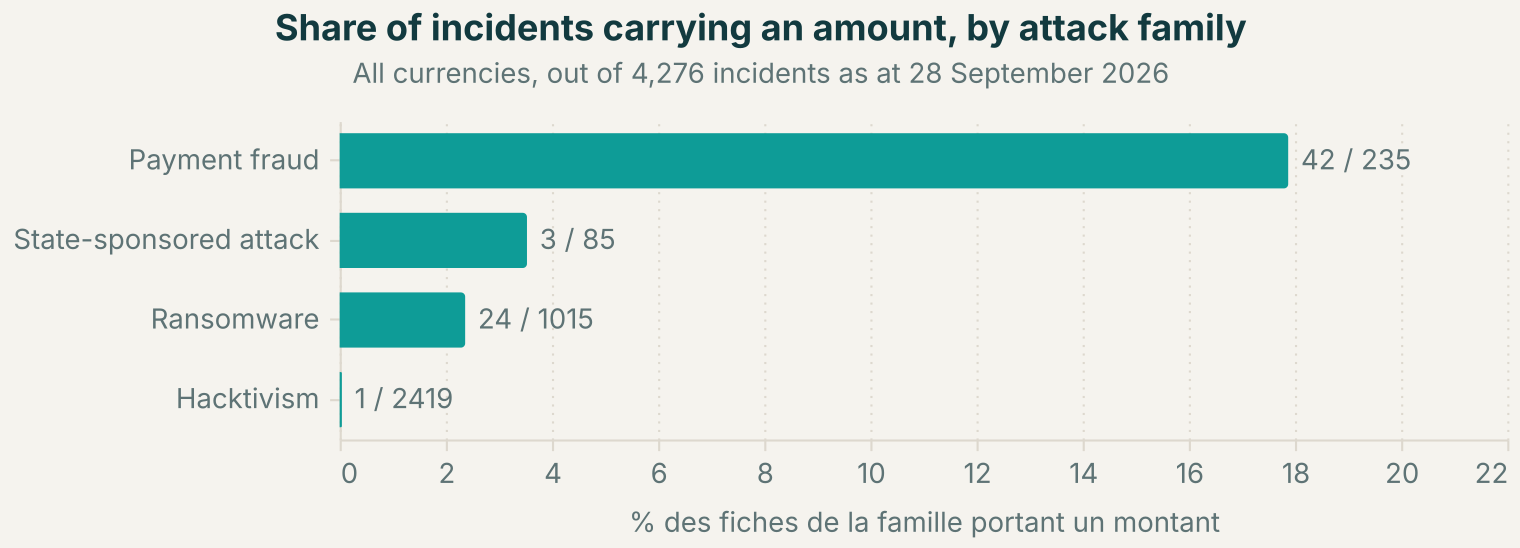
The spread of those 83 incidents does not follow the volume of attacks: the cost of the event is rarely available for a denial of service, and hardly more so for ransomware. And, save for particular regulatory situations, the amounts only surface years later.
A state-sponsored attack is costed when something has to be repaired
Three incidents out of 81 attributed to a state carry an amount, and each of the three was costed by a third party that had to do it, the auditor of a listed group or the yard in charge of the repair. The Maersk case, 300 million dollars, comes out of the financial report of a listed group, while the overall impact of the same attack has several times been put, for United States companies alone, at more than a billion dollars. The other two are repairs to subsea infrastructure: a damaged gas pipeline in the Baltic Sea, whose repair approaches 300 million euros, and a cable cut between two East Asian islands, 570,000 dollars.
Ransomware sets a price
Ransomware is twelve times more frequent than state-sponsored attacks in this dataset, and barely better documented. Out of 1,015 incidents, only 24 carry an amount, or 2.4%. Three of them carry two, a ransom demand followed by the price at which the stolen data was later put up for sale, or followed by the sum actually paid, which makes 27 amounts in all. Of those 27, 21 are set by the attacker and 6 are borne by the victim. The demands run from 4,000 dollars, addressed to a small French marine energy company, to 60 million addressed to a North American insurer that paid 40. The median demand reaches 1.5 million dollars, across the 17 demands a source states in, or converts to, dollars.
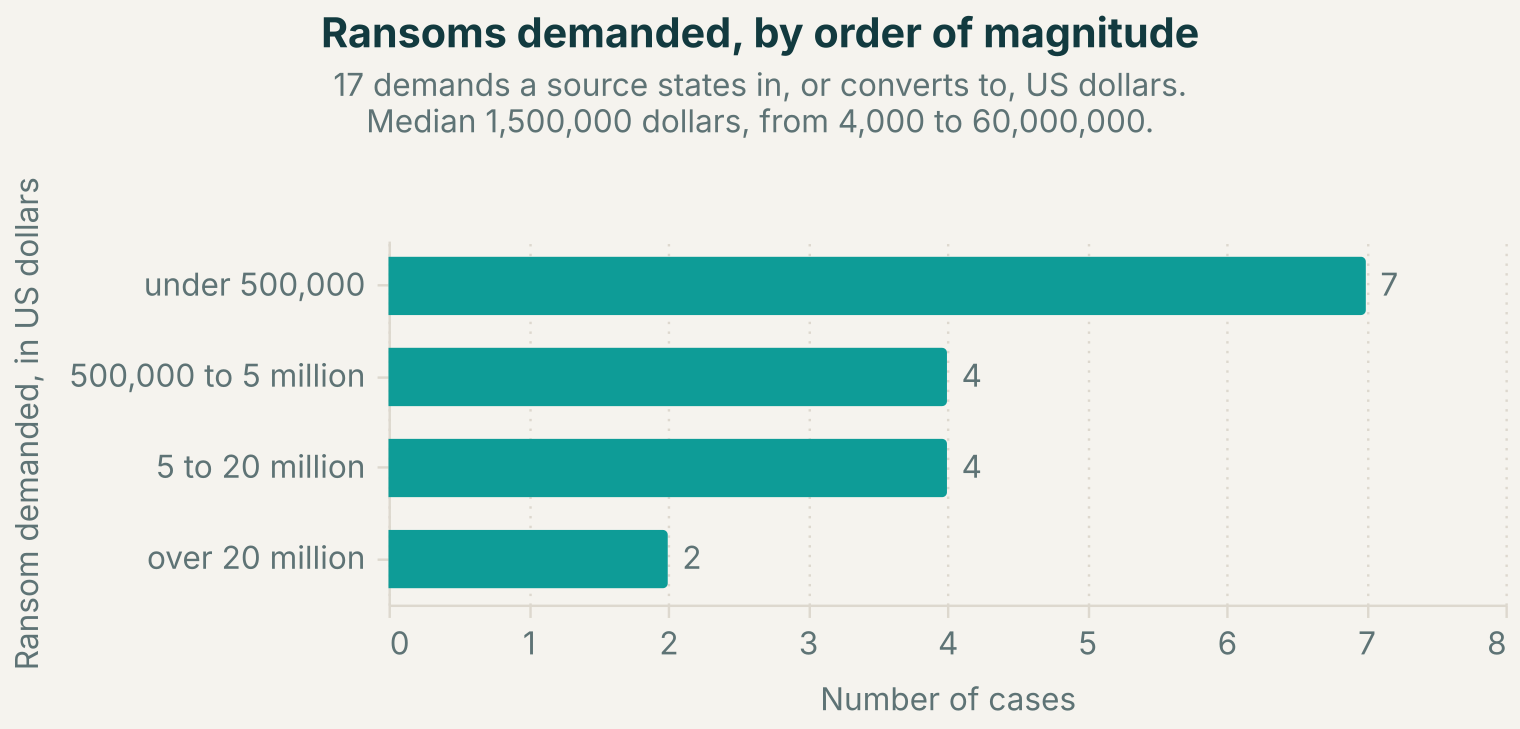
Ransom amounts are generally set according to the victim’s financial standing, and so that the demand remains “acceptable” to it. Several groups work theirs out as a percentage of the turnover they read off a company directory, and the damage suffered counts for nothing in that calculation. Only five cases carry a real loss, all of them in organisations required to publish. A listed boating manufacturer reports 85 million dollars, an oilfield services provider 35 million, an electronic components maker 21.4 million. For an inland port in the western United States or a ship repair yard, no such document exists. The cost of the shutdown often stays unknown even when the incident itself is public.
Hacktivist claims
The gap is wider still in the largest family of all. One amount across 2,414 incidents, and it comes from the attacker: 100,000 dollars asked by a group for personnel data from a navy. No victim in this family has published a loss, and the 2,356 denial of service events recorded carry no documented cost.
The explanation lies in the nature of the harm. A few hours of downtime on a public website trigger no invoiced restoration and no insurance claim. What remains is the claim of responsibility, which carries no figure. Measuring the real effect of these campaigns calls for a separate instrument, an independent read-only probe against the announced targets, whose results I described in a method article.
Payment fraud
Then comes the family that gets talked about least: payment fraud, the fake transfer order or business email compromise. It is nonetheless the one we have the most figures on. Indeed, 41 fraud incidents out of 225 carry an amount, or 18.2%, ten times the ransomware rate.
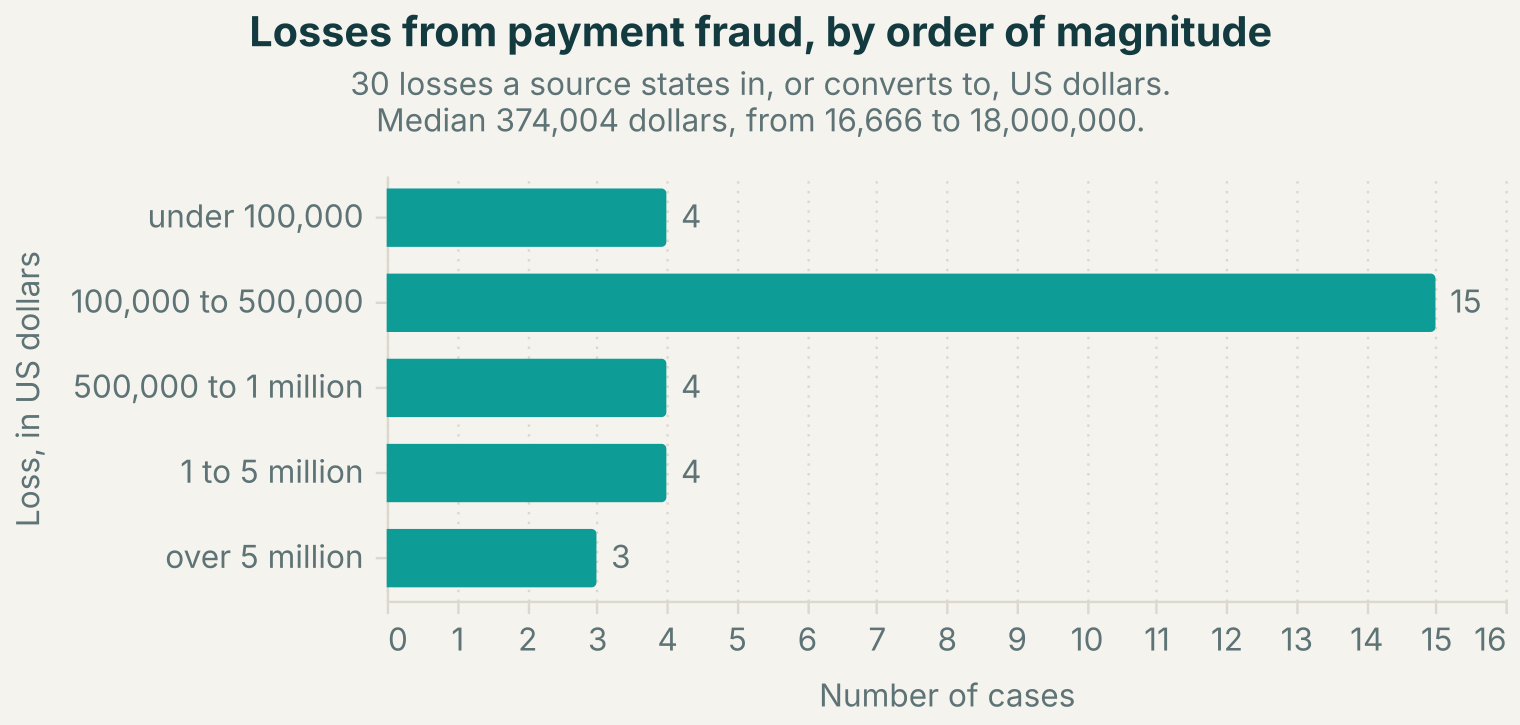
A diverted transfer is a single exact number, one that accounting has to reconcile, that an insurer has to handle, that a judge can order to be returned. 29 of those losses are stated in dollars or converted by a source. The median stands at 388,000 dollars and 22 of the 29 stay below the million. The range runs from 7,300 euros for an interior fit-out supply to 18 million for a bunker supplier. That is the order of magnitude a shipping agency, a broker or a mid-sized yard absorbs in its yearly result. The vector has been documented as routine for a long time, including in United States Coast Guard bulletins. So are the measures that stop it, which the FBI’s Internet Crime Complaint Center sets out for companies, starting with verification of any change of banking details through a separate channel [1].
The items one can separate
That leaves the question opened by the list of items at the top of this article, what an incident finally costs the party that suffered it. Answering it means knowing how a total is made up, and the dataset almost always records the total, rarely its composition. Rebuilding the information system can be read in a handful of cases, lost revenue in three, incident response in nine, notification of the people concerned in twenty-five.
Two files give both ends of the chain, from the transfer that left to the charge booked in the accounts. A Canadian bulk terminal sees 6.2 million Canadian dollars leave in four transfers. It files a civil claim, obtains a default judgment, notifies its insurer, and finally books 2.6 million as a charge in its first quarter report. A United States port authority pays 16,666 dollars to a fraudulent supplier, recovers 14,166 through its insurance, and keeps 2,500 dollars as a net loss, which is its deductible. The amount diverted and the final cost are two distinct numbers: the terminal keeps 42% of what left, the port authority 15%.
Fines, the last item on my list, are the most erratic variable. The dataset holds three. A cruise operator pays 1.25 million dollars before the financial regulator of a United States state. An offshore vessel owner pays 18,000 Singapore dollars. A Korean shipyard, after a theft of hull plans, pays 4.8 million won, about 3,400 dollars. No common scale connects those three penalties.
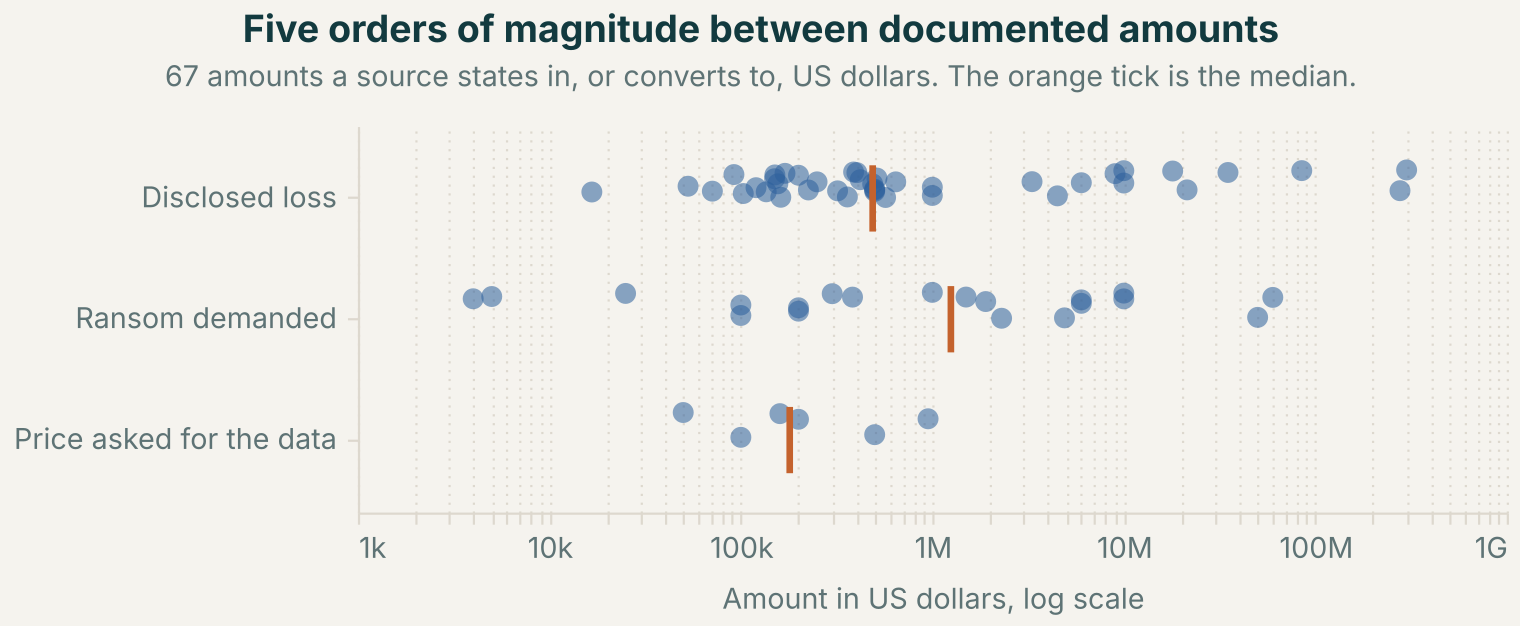
All told, the 66 amounts a source states in, or converts to, dollars span five orders of magnitude, and they do not measure the same thing depending on which line they sit on. A disclosed loss comes out of the victim’s accounts, a ransom demand and a data price come off the attacker’s page.
Taking stock
The two largest amounts in this dataset have no attacker at all. A Swedish roll-on roll-off ferry capsizes in June 1980 off Cyprus, a few days after delivery, on an error in the ballast software: 200 million pounds of cargo on the seabed. A United States Navy vessel grounds in January 2013 on a protected reef in the Philippines, the electronic chart placing the obstacle some 15 km (8 nautical miles) from its real position; removing the hull will cost 277 million dollars.
So yes, a cyberattack costs the maritime sector, and no single figure sums that cost up. The one we know how to document at scale is the diverted transfer, a few hundred thousand dollars each time, in a family of attacks that rarely makes the headlines. The cost of downtime can only be read at listed companies. No flag state today requires anyone to declare what a cyber incident cost, and the most complete accounts in the sector sit with the insurers, who do not publish them.
Sources
- Business Email Compromise, Internet Crime Complaint Center, Federal Bureau of Investigation, accessed 27 September 2026.
